Analytics
With Blossom, you can look at your project’s analytics:
- Instantly: Via the Analytics Dashboard.
- Scheduled: A daily, weekly, monthly or quarterly email report.
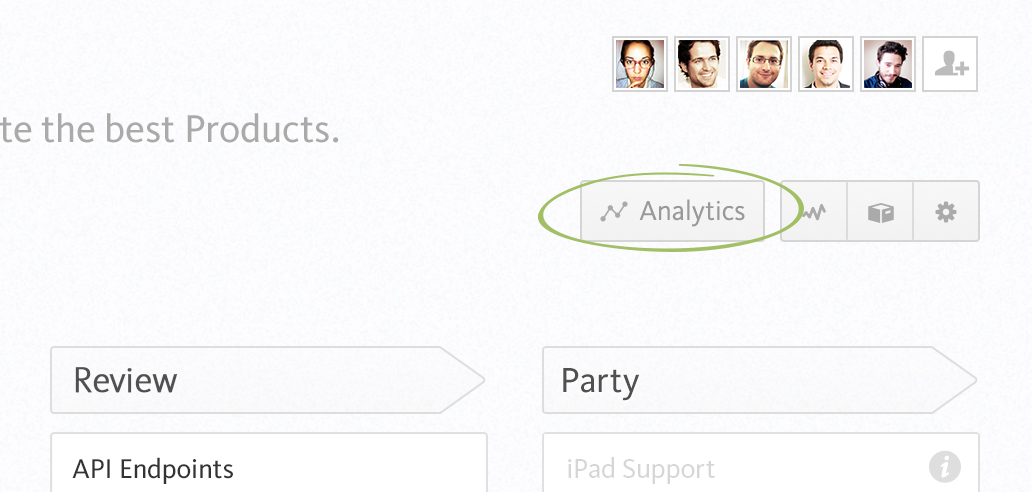
By clicking the “Analytics” button in a project, you will be able to see the Analytics Dashboard for that project.
In the Analytics Dashboard, you can see a number of insightful things:
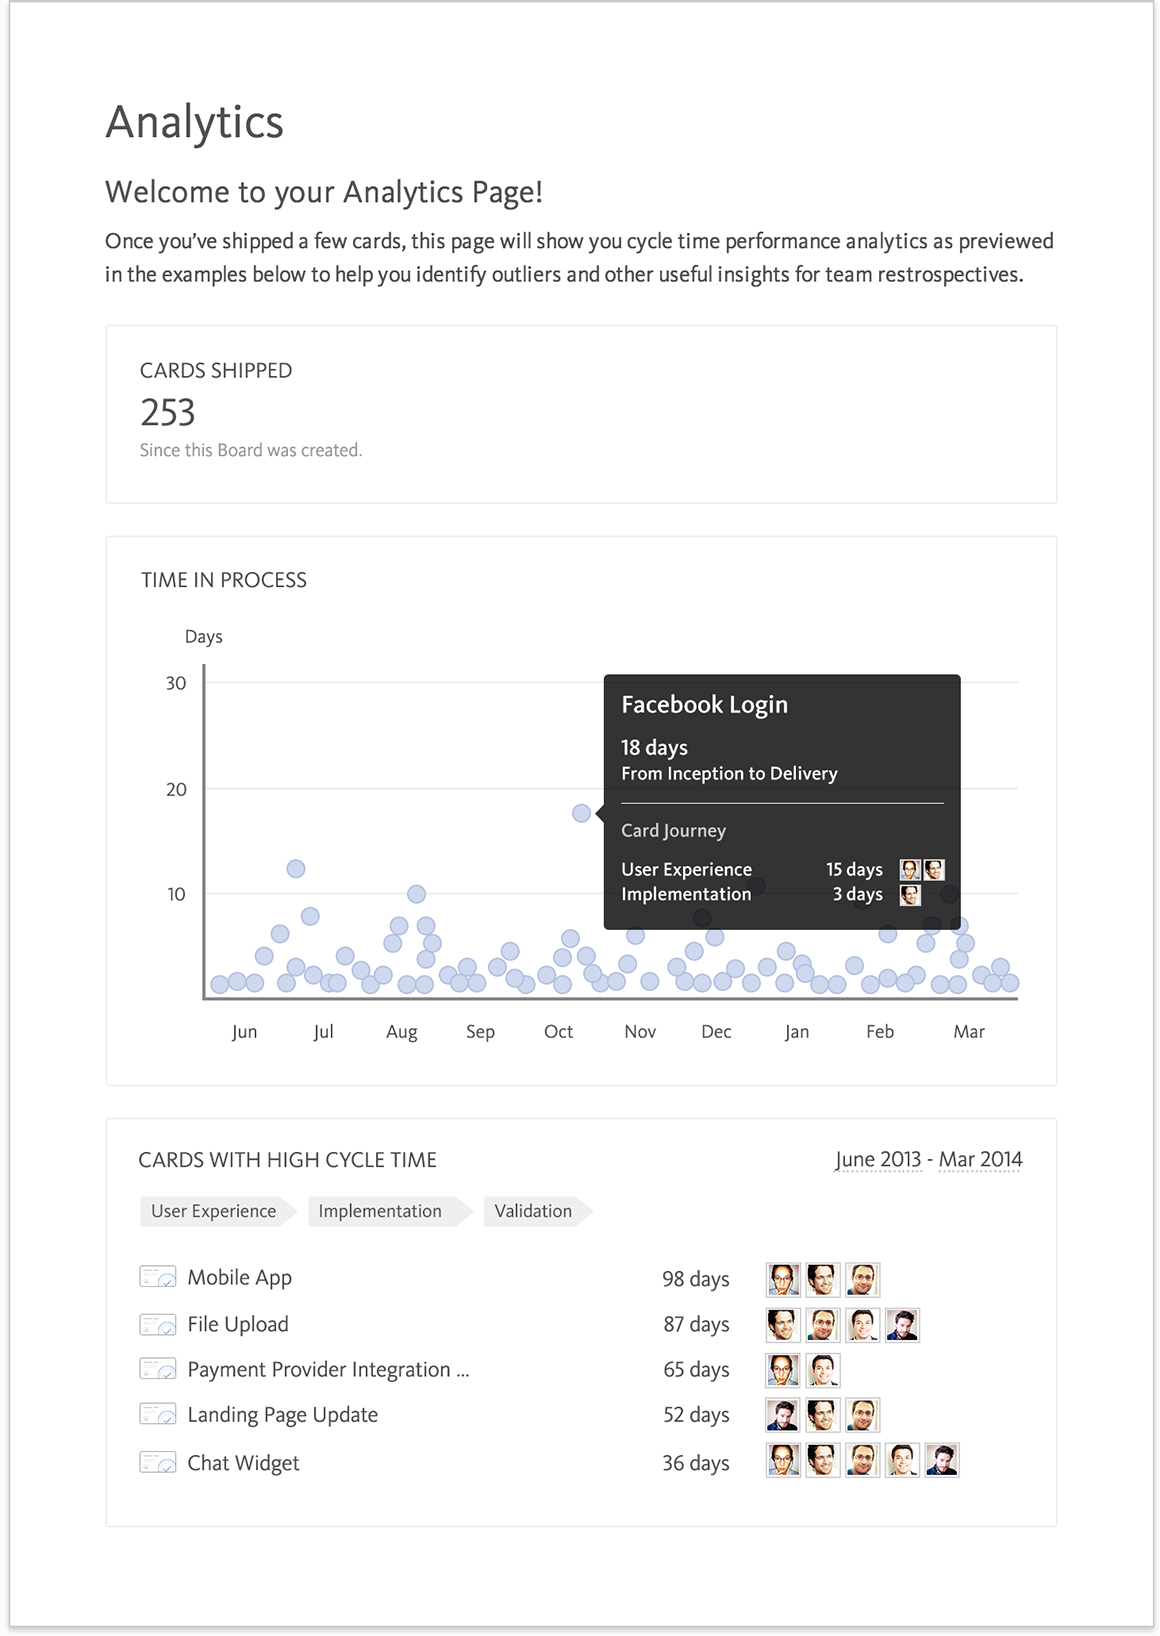
Cards Shipped #
This is the total number of cards shipped in the project.
Time in Process Chart #
How long each card took from inception until delivery, across time.
Recently Shipped Cards #
Cards that have recently been shipped.
Great for retrospectives!
Cycle Time Outliers #
Tasks that took longer than the normal to get from inception to delivery.
Also great for retrospectives!
Time Tracking and Estimates #
Blossom’s feature cards do not store estimates as we use cycle time (can be accessed via the “Analytics” button in the top right of your project board or in the top right corner of a card that’s in the last stage of your board). It measures the time from inception to completion of each feature card, automatically. That way the team can look back on the actual time of development of a card (evidence based) and can get a good feeling on how certain cards took to flow through the board.
Best Practices for Analytics #
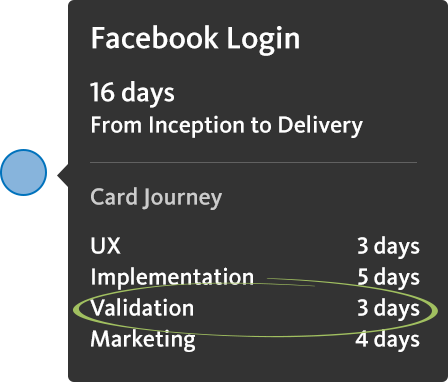
Use the information in the Time-in-Process Chart to analyze how much time a card spent in each stage of the process and improve the workflow by getting the whole team together and talking about the process. You’ll understand idle times of card’s that have been marked as ready, prevent blockers and bottlenecks in the future. After a few iterations and continuous optimizations work will flow smoothly through your boards from left to right.
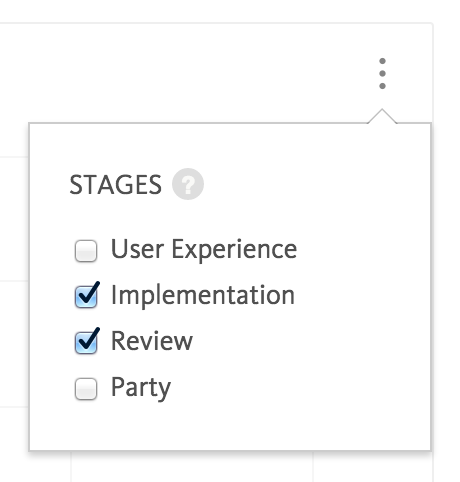
Filter the stages in the Time-in-Process chart to find out how much time the cards spent in certain stages only. For example to exclude the first stage of the total cycle time.